With Q1 2018 almost over, I thought this a good time to review the technical stability and performance SLAs of the DSB and to explain our actions to date and plans for the future.
The first port of call for stability and performance is the information on the DSB’s website, within the Operational Status page which is located under the Knowledge Centre menu: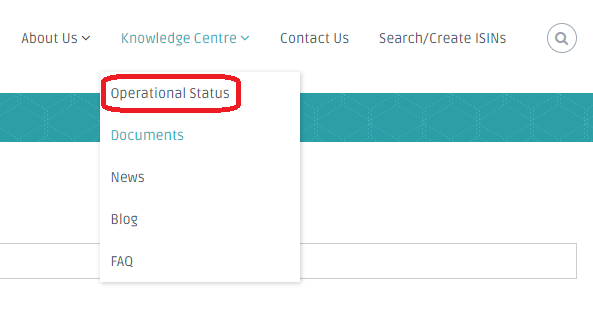
This page shows both availability and performance statistics. I will cover each in turn.
DSB Availability
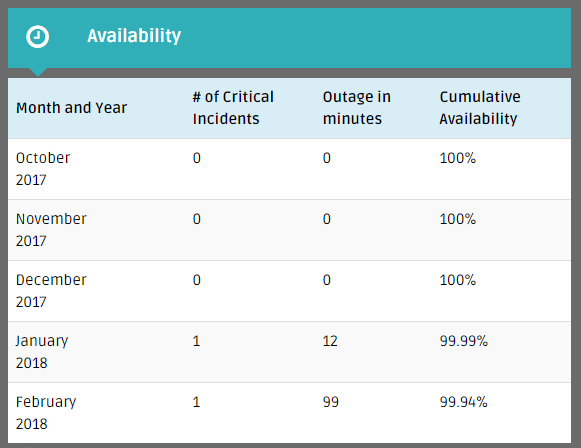
The table below shows that after a flawless Q4 2017, the DSB suffered a severity one outage in both January (12 mins) and February (99 mins). What’s more, the duration of the outage was longer in February than in January and the Root Cause Analysis documents make clear that the issue was the same both times.
So, the obvious questions that spring to mind include: can the issue recur? If yes, is the DSB putting appropriate focus on stability to resolve the issue once and for all? And how can industry have comfort that the DSB will be able to fix the issue once and for all? The answers to these questions are respectively: Yes, definitely and read on…[and a major warning: my information is targeted at technology experts in order to provide crisp and detailed technical information!]
The Background
As the root cause analysis documents in the operational status page make clear, the issue is related to Java Garbage Collection (GC) occuring under large load within the DSB’s Apache Solr process. Solr is used by the DSB to handle all DSB search queries as well as to cache administrative information such as user credentials.
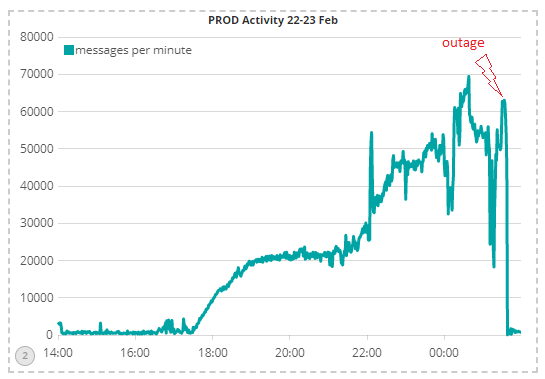
As an example, this chart shows that system load at the time of the February outage was above 60,000 messages per minute following a long period of sustained activity above 20,000 msgs per minute:
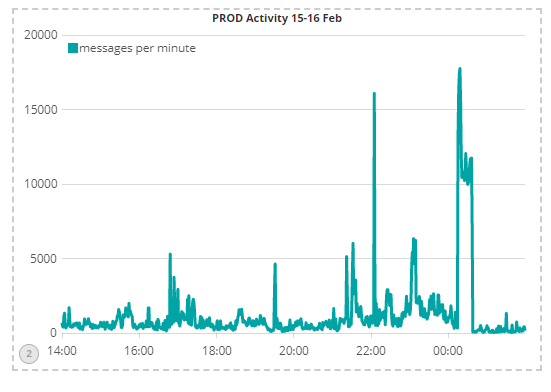
As a comparison, I have shown the same chart for the same time the previous week, showing maximum activity of around 10,000 msgs per minute with brief bursts that still stayed under 20,000 msgs per minute:
The outage occurred as a result of the Solr process freezing for > 30 seconds as the high load caused over 2 Gb per second of Solr objects to be created at peak, triggering the GC pause.
This large pause caused the DSB’s Apache Zookeeper process (which the DSB uses for configuration management) to conclude that the master Solr process must be dead and to disconnect it from the service and to inform all other DSB processes of the outage. Given the DSB’s multiple redundant systems, a different Solr instance then became the master and attempted to catch up on the large volume of requests that were still flowing through the DSB. However, the processing volume was so great, that recovery was taking a long time and therefore support decided to stop all end-points (ie stop new requests flowing into the system), restart all Solr instances, and then bring back each end-point (FIX, REST, GUI) one by one.
Now, to answer the original questions in turn:
Can the Issue Recur?
The short answer is yes, because although the mitigation following each outage reduces the likelihood of a recurrence, they do not guarantee a complete resolution. More specifically, the DSB has:
- Tuned the Java environment to minimise the possibility of a large GC pause based on the Java 8 Concurrent Mark Sweep algorithm.
- Increased the hardware resources available to Solr – both CPU and memory. In particular, the SOLR processes are now running on powerful EC2 m5.4xlarge servers
- [as of 19 March] Increased the timeouts between Zookeeper and Solr from 30 seconds to 120 seconds (so that a 30 second pause should not result in Zookeeper deciding the master Solr process is dead)
Is the DSB Focused on a Strategic Fix?
We are absolutely focused on this as our number one priority, given the industry feedback that stability and availability should be the DSB’s highest priority.
We initially considered strategic fixes that would minimise the impact on the DSB technology team. We therefore considered migration to Java 9 and the use of the Java G1 GC algorithm. Hard-core java tuning experts will be aware that the Java 9 G1 GC promises to achieve sub-second pause times almost out-of-the-box. However, after much deliberation, we decided that Java 9 was still too new (released in Q4 2017) to risk deployment onto a critical infrastructure, so whilst this is definitely a technology that is on our watching brief, we felt we had to go down a more traditional route that would guarantee a fix to a defined timeline.
The alternative solution has been to work with CNRI to implement changes in the CORDRA component to optimise its use of Solr. CORDRA is used by the DSB for the lifecycle management of ISIN records and within the DSB configuration, makes extensive use of SOLR. Our chosen approach has been very time-consuming, given the requirement for extensive analysis and testing to ensure a re-architecture does not introduce its own issues. At times, the entire DSB technology team has been focused on this project, which is a sign of the seriousness with which the DSB has taken this issue.
So what is the status of this strategic fix? Well, the software has been designed, implemented, deployed and tested within the DSB’s internal QA environment. The indications so far have been good and the software was promoted to the public UAT environment last weekend. We will be monitoring the UAT environment intensively for several weeks in order to observe the behaviour and validate that nothing has broken as a result of the re-architecture.
Can Industry have Comfort that the Issue will be Fixed Once and for All?
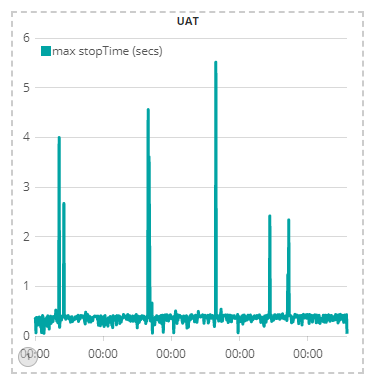
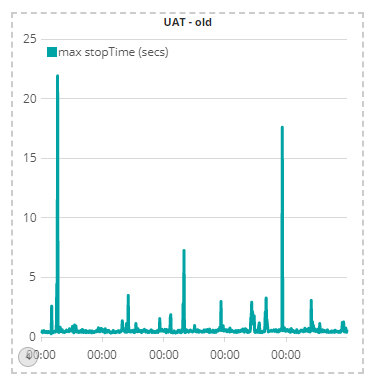
The best place to start on this question is to show the current UAT behaviour compared to the original behaviour. This chart shows the maximum pause time in UAT since the re-architected software was deployed. It shows once-a-day (or so) pauses in the single-digit second level, with no pauses in the double-digit seconds:
This chart shows the maximum UAT pause time in the week before the deployment of the new software. It shows two large-ish spikes during the week, of 22 seconds and 18 seconds that have not recurred since the new software was deployed:
Of course, it is early days yet and we will continue to monitor the situation intensively to validate that GC pauses do indeed stay low.
But we also wish to address the industry comfort directly, by setting a date when industry can perform a load test with us to validate the resiliency of the new system under load. We are constructing the plan for such a load test and we will be reaching to DSB users next week to agree an industry-wide test. As a heads up, our current thinking is to perform the industry load test on either Friday 6th April or Saturday 7th April, depending on industry preference, but we are happy to receive industry input on this.
DSB Performance
Moving on to performance, keen observers will have noticed that in Q4 2017 the DSB achieved its target SLA to process 99% of all messages within 1 second, but that it narrowly failed to meet this target in January and February.
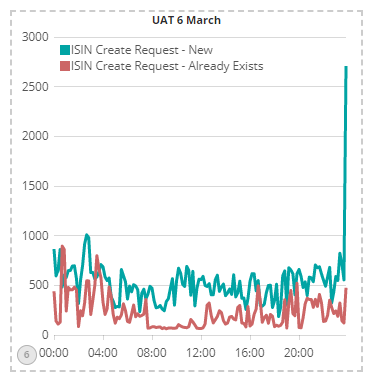
So, what is the DSB doing to get back on track? Well, our huge re-architecture effort to provide a strategic fix for stability, has put us in a good place. This chart shows average latency in milliseconds in UAT on a day before the new software was deployed:
This chart shows the average latency in UAT for the same day a week later, after the new software was deployed:
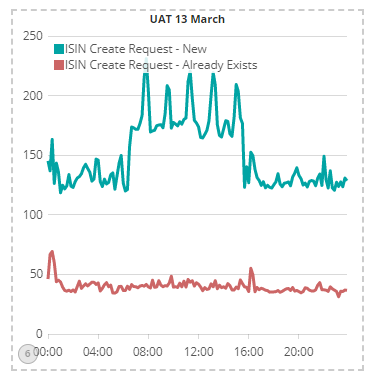
A few observations:
- The latency jitter is lower with the new codebase
- There is a 2-3 fold improvement in performance / latency for the ISIN create request workflows
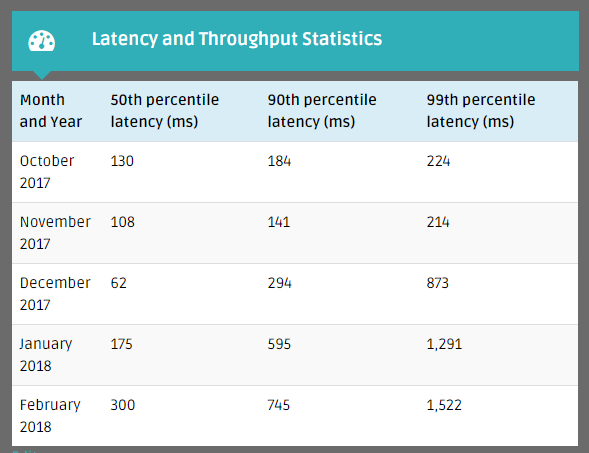
Also, a word of caution: The above figures are average latency figures (not median and certainly not 99%-ile) in UAT. The table below provides the like-for-like median and 99% ile comparison for the weeks in question in UAT. The figures show the new codebase provides a dramatic improvement in UAT latency:
| Date | 50th percentile of latency (ms) | 90th percentile of latency (ms) | 99th percentile of latency (ms) |
| March 5th 2018 | 202 | 1,154 | 1,802 |
| March 6th 2018 | 583 | 1,289 | 1,814 |
| March 7th 2018 | 691 | 1,409 | 2,006 |
| March 8th 2018 | 714 | 1,491 | 2,301 |
| March 9th 2018 | 794 | 1,499 | 2,019 |
| New codebase | |||
| March 12th 2018 | 39 | 182 | 326 |
| March 13th 2018 | 62 | 195 | 316 |
| March 14th 2018 | 35 | 62 | 222 |
| March 15th 2018 | 36 | 65 | 223 |
| March 16th 2018 | 51 | 179 | 249 |
These figures make us quietly confident that production latency will fall significantly once the strategic fix for the stability issue is deployment into production.
In Conclusion
For the hard-core OTC derivative technologists amongst you, I hope this glimpse into the technology operations of the DSB has been interesting. We intend this article to be the first of a series of occasional blogs providing informal colour and information that helps explain the technology focus of the DSB.
We also intend to facilitate a formal dialog on the DSB’s technology roadmap through the technology webinar on Wednesday 22 March at 3pm UTC and the subsequent meeting of the DSB Technology Advisory Committee planned for Q2 2018.
If you have not yet registered for the technology webinar and if you have found this information useful, then we recommend attending the webinar by sending an email to secretariat@anna-dsb.com: we want to hear your thoughts and we will be delighted to answer your technology-related questions.
Sassan Danesh, Management Team, DSB