A couple of weeks ago, I provided a glimpse into the technology operations of the DSB, with a focus on performance and resiliency. Last week, we hosted a technology-focused webinar, the recording of which is available on our web-site. In this blog, I want to bring readers up to date with the latest changes within the DSB’s UAT test environment, as we ramp up our preparations for the industry load testing on Friday 6th April.
To recap, the DSB technology team have put a huge effort to optimise the ISIN engine codebase, in order to address the capacity bottlenecks that resulted in a total of 111 minutes downtime over the 5 months from 2nd October 2017 to end of February 2018.
The first iteration of this work was deployed into UAT on the weekend of 10th March. I provided details of the performance impact of this version in my previous blog.
After close observation of UAT, the technology team deployed a second iteration of their work into UAT on the evening of Tuesday 27 March. In the rest of this blog, I will provide details of the impact of this second iteration.
Java Garbage Collection Pause Times
First off, let’s look at the GC pause times, which were the cause of the production outages. I have selected a representative day (Thursday) in UAT based on dates when the PROD codebase was in UAT, the first optimised codebase was in UAT, and finally when the second iteration of the codebase was deployed into UAT:
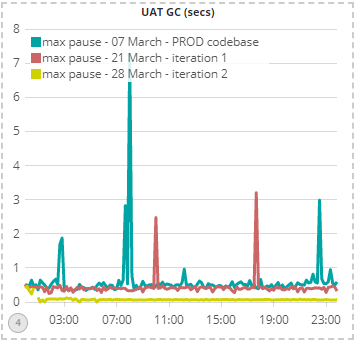
The chart shows that on 7th March, the UAT environment, running the same codebase as PROD, had 4 pauses of between 2 – 8 seconds (the blue line). The first iteration of the optimised codebase (red line), reduced peak GC pause times significantly, although a couple of 2-3 second pauses still occurred. Finally, the second iteration of the codebase suffered no spikes in GC pauses at all as well as reduced the average pause times four-fold from around 400ms to around 100ms.
I want to emphasise the radical improvement that the above charts imply: these results are little short of miraculous and demonstrate the massive effort expended by the DSB technology team to address the performance & capacity bottlenecks head-on.
Impact on Latency
Next, let’s look at core latency across the 3 days:
| Date per day | 50th percentile of latency (seconds) | 90th percentile of latency (seconds) | 99th percentile of latency (seconds) |
| March 7th 2018 | 0.13 | 0.748 | 2.191 |
| March 21st 2018 | 0.042 | 0.133 | 0.308 |
| March 28th 2018 | 0.037 | 0.126 | 0.196 |
Readers will be aware that the DSB performance SLA is for the 99th percentile latency to be below 1 second from the DSB end-points. The above table shows that the PROD codebase failed to achieve this SLA on Thursday 7th March, but the subsequent iterations of the optimised codebase show considerable promise.
The table also shows a three-fold improvement in median latency between the PROD codebase and the first codebase optimisation effort, rising to a seven-fold improvement in latency at the 99th percentile.
The second iteration of the optimised codebase improved 99th percentile latency by another 50%.
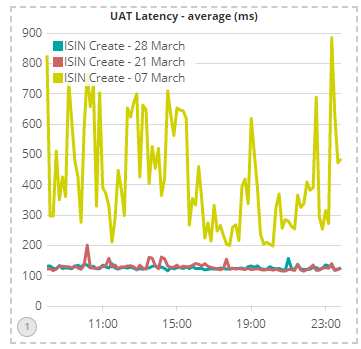
The chart below shows average latencies within the core for each codebase and highlights the significant reduction in latency jitter compared to the PROD codebase. This reduction in jitter will result in a much more predictable performance profile for DSB users:
Technical Details
So how did the DSB technologists manage to pull off such seemingly amazing improvements? There were two main focus areas:
- Reduction in the use of SOLR by implementing internal caches within the ISIN Engine codebase
- Reduction in object (and therefore, ultimately, garbage) creation within the ISIN Engine codebase
The hard-core Java real-time performance tuning experts amongst you will be aware that optimisation of object creation plays a key role in minimising java GC pause times. For everyone else, the key point to note is that a large amount of objects in survivor space is “bad” and a smaller amount is “good”.
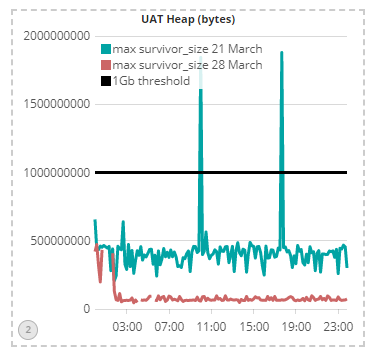
On this basis, the chart above shows that the second codebase iteration is a major improvement over the first iteration.
Unfortunately, I cannot auto-generate the 7 March PROD codebase survivor-space chart as we only recently integrated the instrumentation data into our Big Data analysis software (we use the open-source ELK stack, by the way). Instead, I have shown the survivor-space from PROD on 21 March, to provide a proxy:
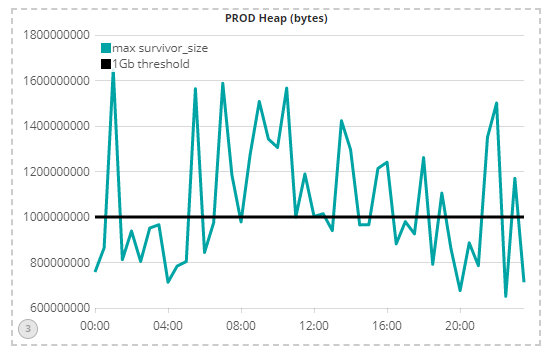
This chart shows that the PROD codebase created far more objects (and hence garbage) than the first iteration of the optimised codebase, which as we saw earlier, was itself improved upon significantly, in the second iteration of the codebase optimisation.
These ‘techie’ memory charts explain much of the underlying drivers that resulted in the performance improvements observed in the earlier charts.
Next Steps
Firstly, if you or your firm find this kind of technology-related information useful and you wish to provide input into the DSB’s technology strategy, then you have the opportunity to participate in the DSB Technology Advisory Committee by emailing the secretariat@anna-dsb.com. This opportunity will close once the committee is formed later in Q2, so please do contact us soon.
Looking to next week, our major focus is to facilitate the industry load test on Friday 6 April. We will publish our analysis of the tests by Friday 20 April. Assuming a positive outcome, we will deploy the new software into PROD as soon as possible after this date, after which our focus will move to product and usability enhancements as well as process improvements to continue to increase our transparency and engagement with industry.
If you have not yet contacted the DSB to assist with industry load-testing, you can do so by sending an email to technical.support@anna-dsb.com. We will be delighted to work with you to integrate your performance test requirements into the overall test plan.
Sassan Danesh, Management Team, DSB.