Published by Malavika Solanki
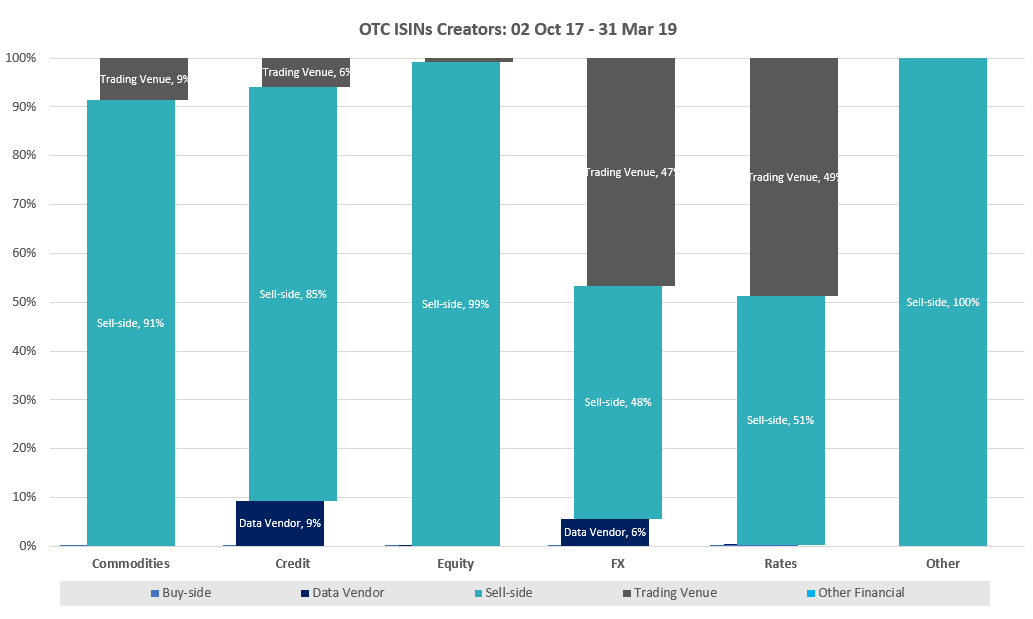
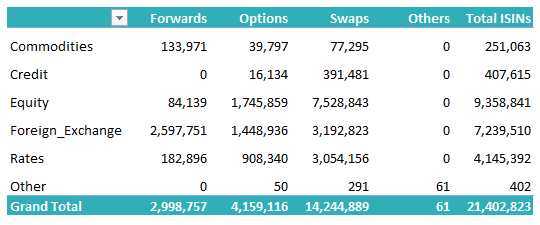
Regular readers will notice that the DSB charts now refer to an asset class of “Other”, bringing the total number of asset classes – for which OTC ISINs, CFI codes and FISNs are available – to six. As usual, this blog starts with a general review of activity, before providing a detailed breakdown of creation by product template and search by connectivity method and search message type.
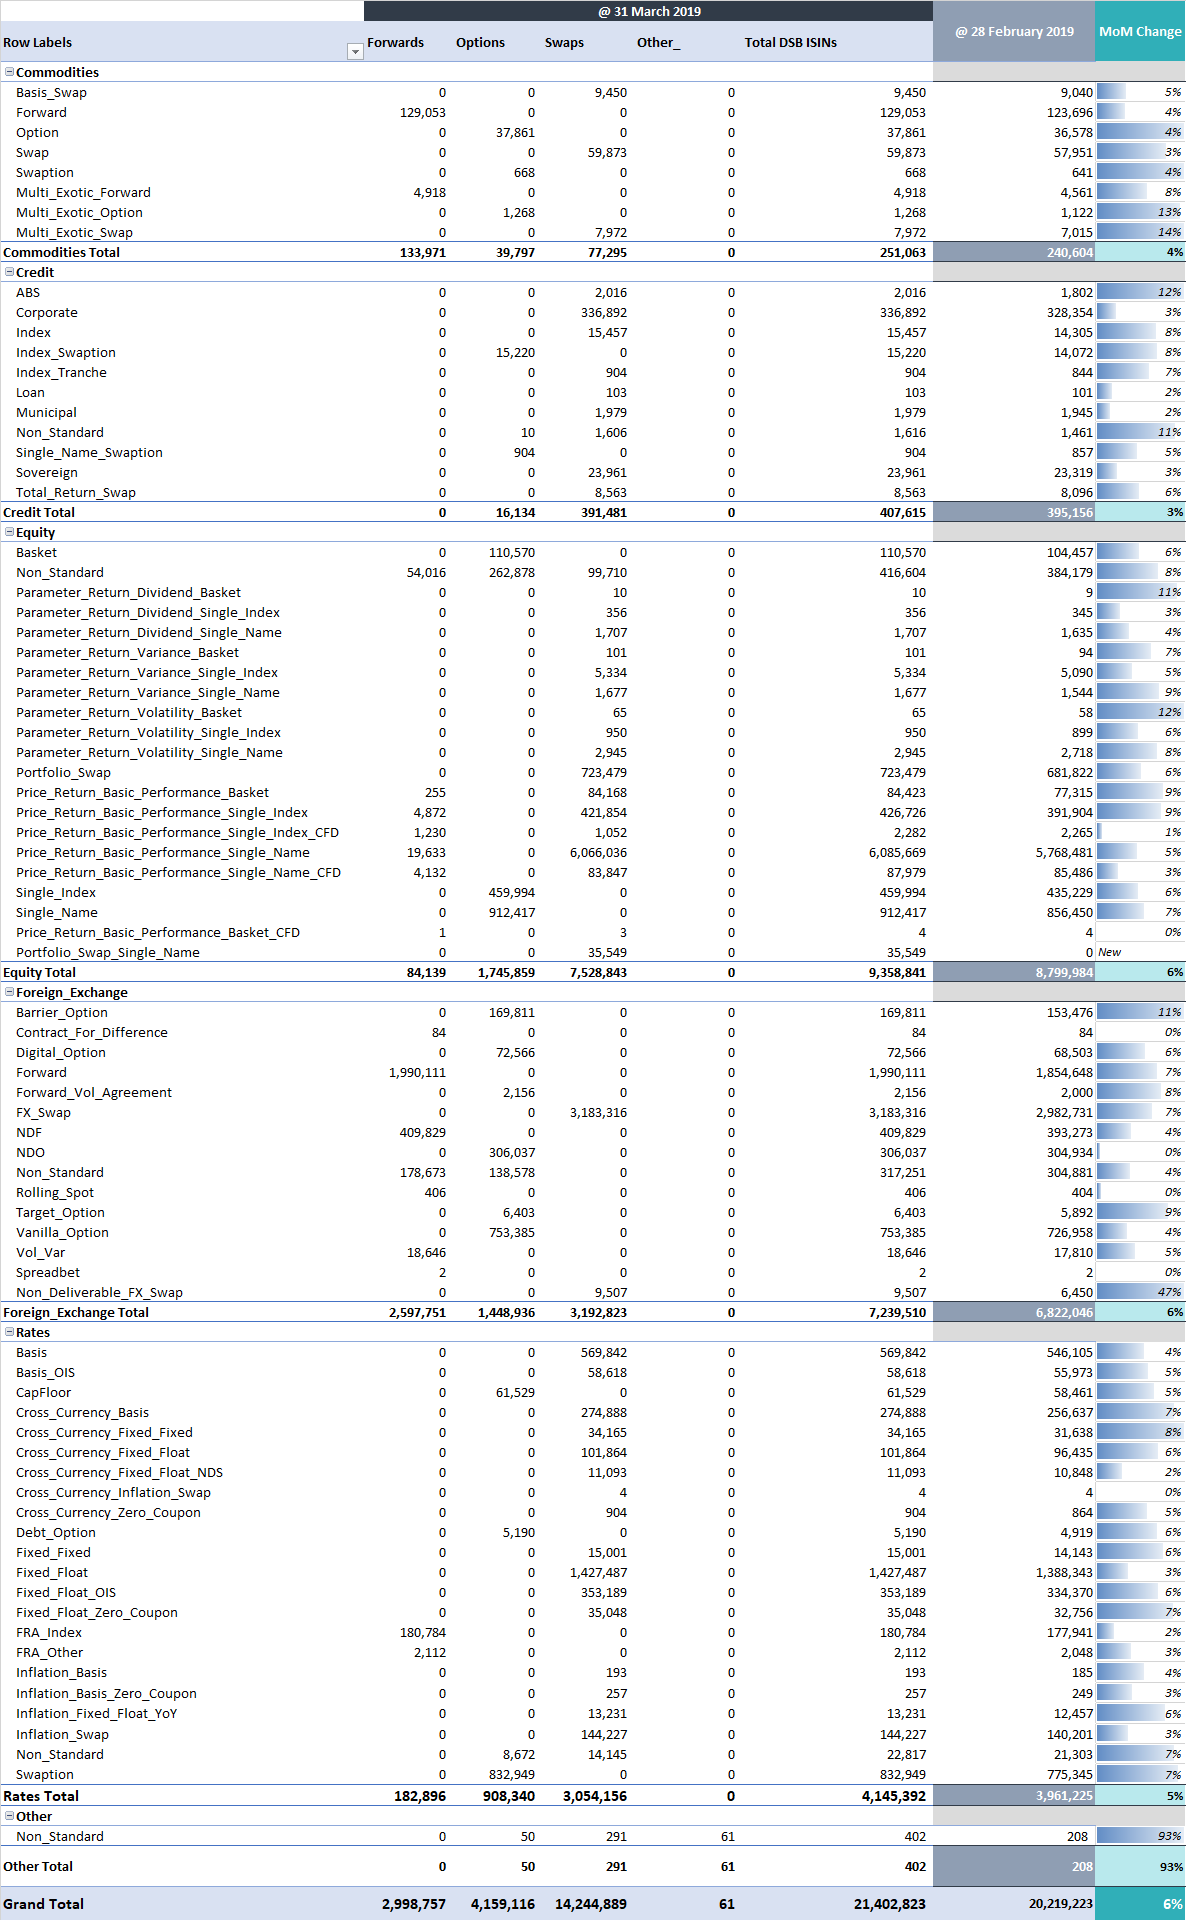
The DSB introduced six new product templates in February 2019 at the request of the sell-side and March statistics show that early adoption of the most complex of these (non-standard instruments in the “other” asset class) has commenced. There has been no ISIN creation activity for the three additional portfolio swap templates yet, but it is early days – with only six weeks of ISIN creation activity available to measure.
As the activity chart below shows, the sell-side continue to dominate OTC ISIN and CFI creation activity, with a growing number of firms now relying on the DSB for CFI generation to satisfy requirements outside of RTS-23 for MiFID II.
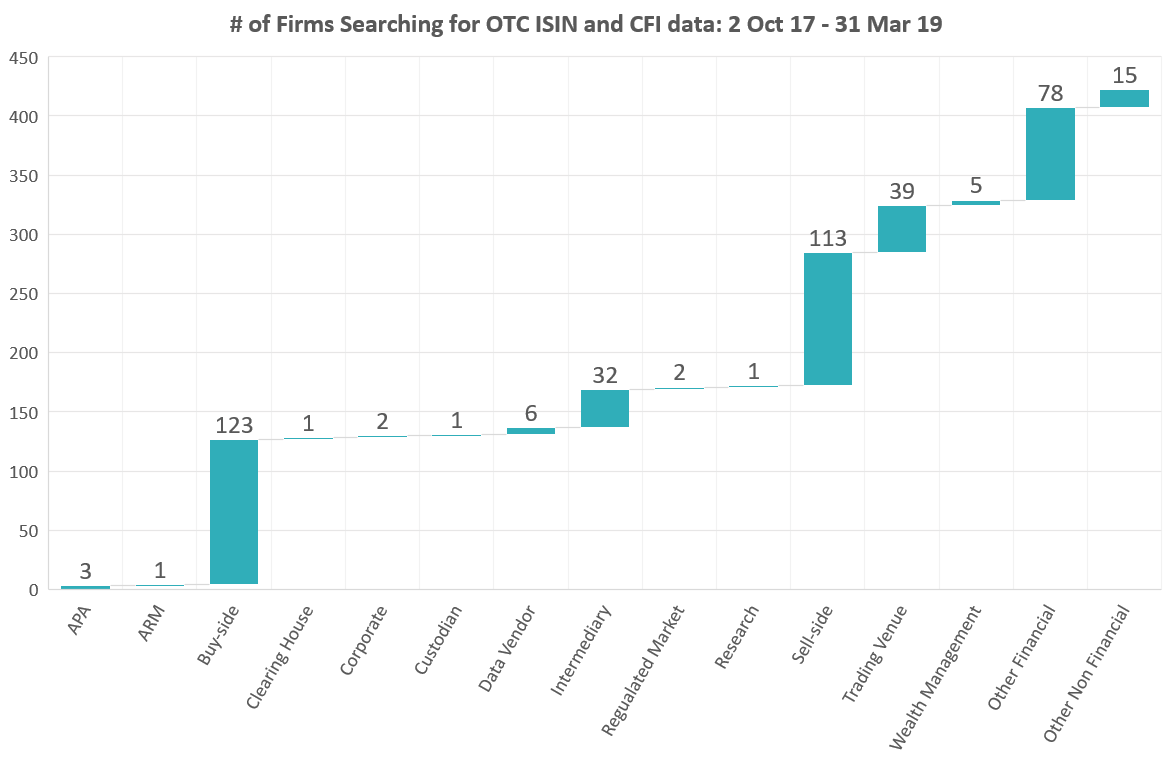
We have also had some requests to show the number of firms searching the DSB for OTC ISIN and/or CFI code information, with the chart below providing an overview by organization type. The data here is particularly interesting as it highlights the broad spectrum of institutions that consume data – in contrast to creation activity being largely the purview of the sell-side and trading venues.
In absolute terms, monthly trends remain largely unchanged as can be seen below.
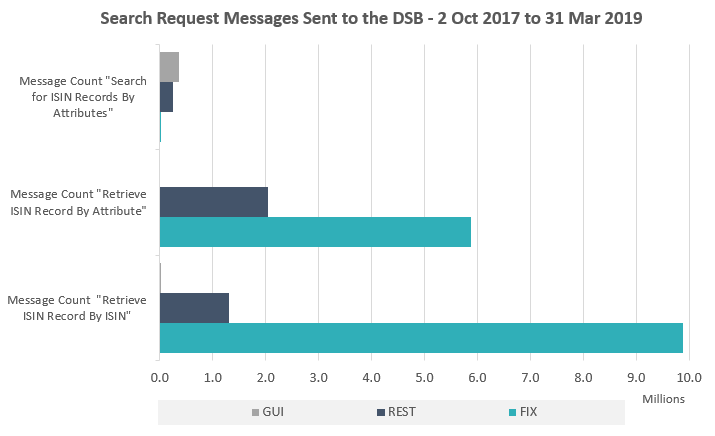
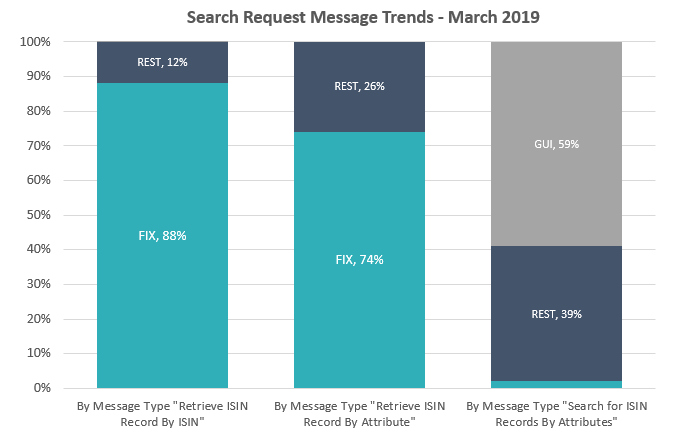
Users’ search request related interactions remain fairly consistent, with FIX based users continuing to dominate programmatic searches within the DSB. As above, the data below shows the volume of messages received by the DSB since inception of the Production service on 2nd October 2017.
— END —