This note focuses on both OTC ISIN creation and search trends to provide users with more insight into how the DSB is being used.
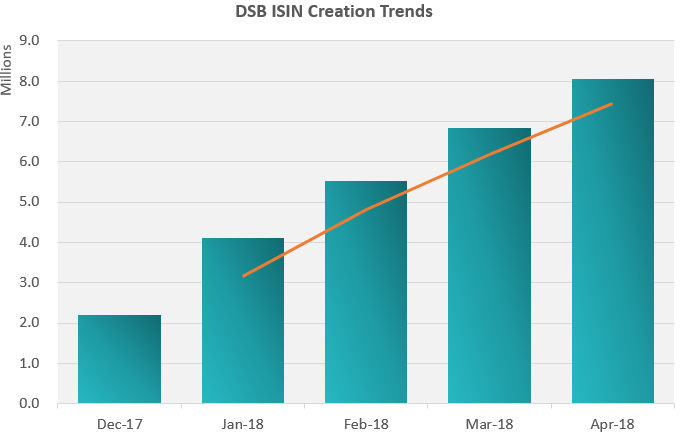
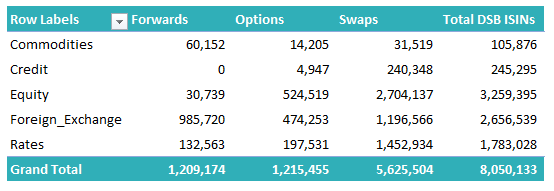
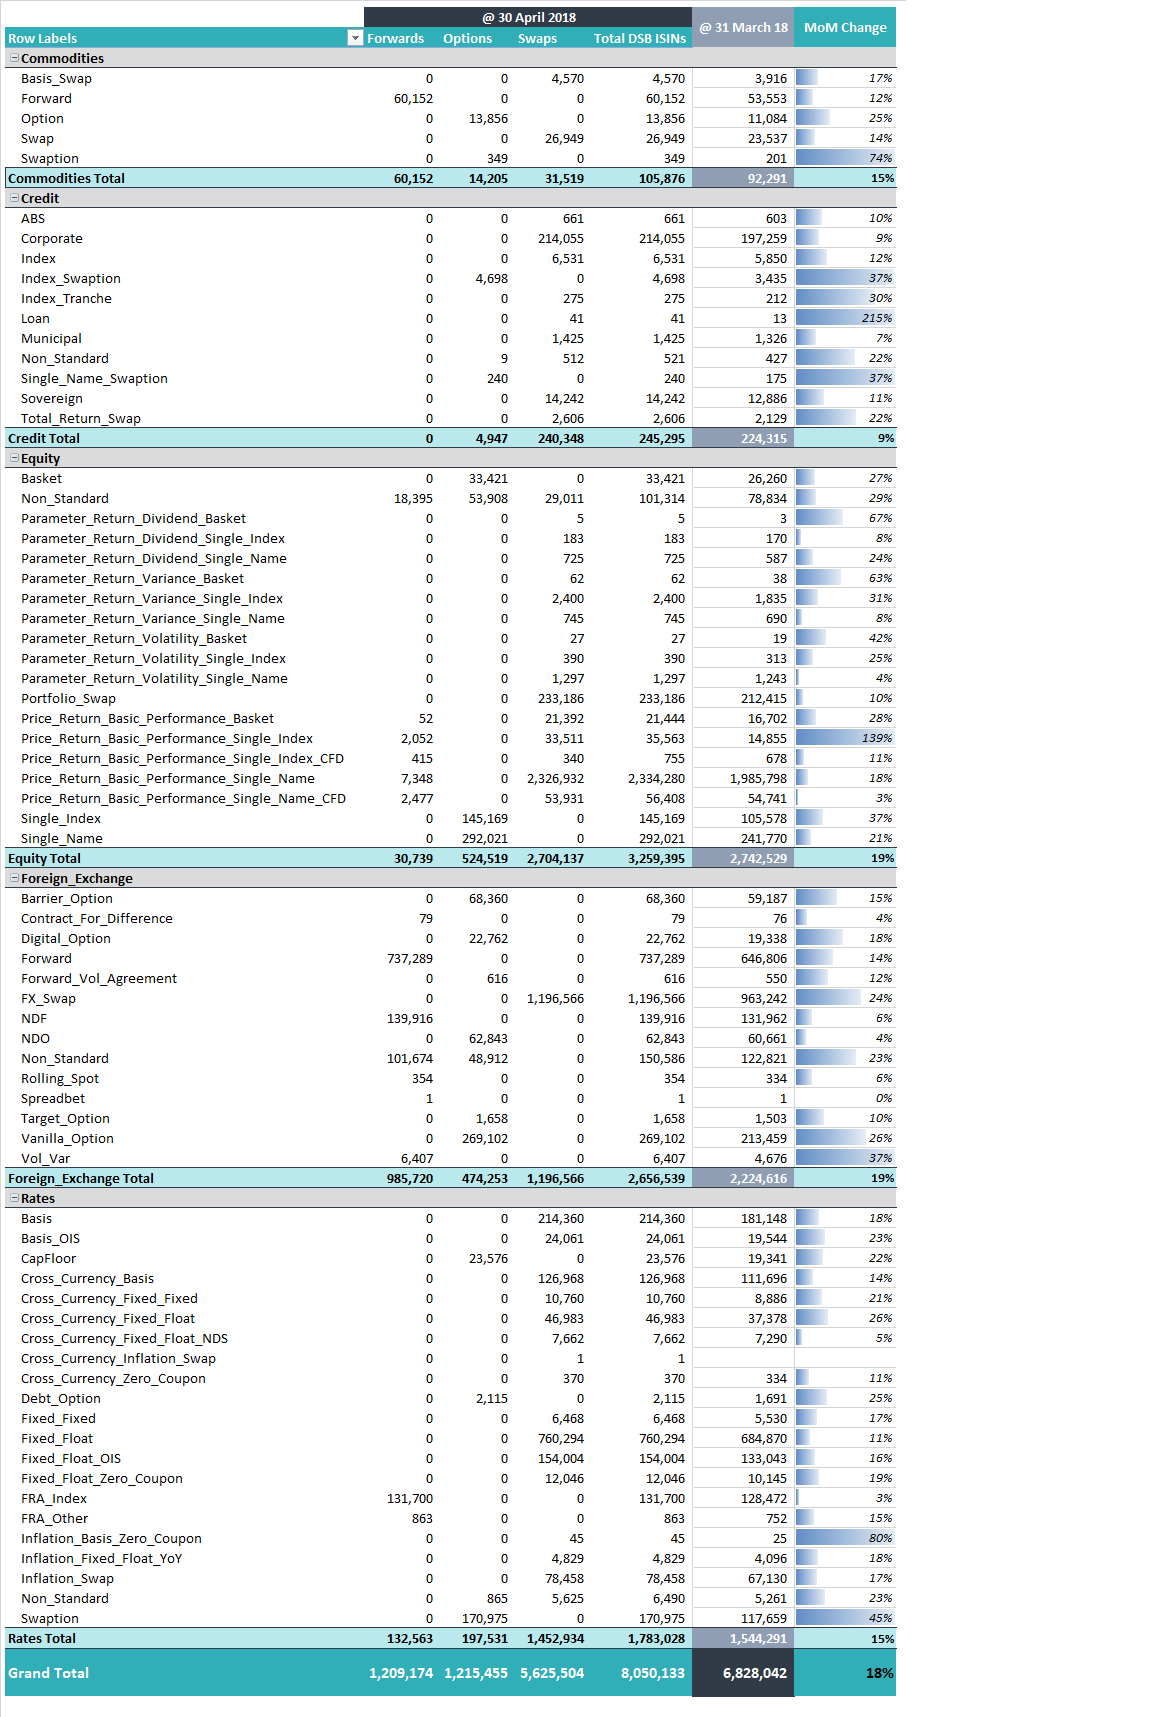
ISINs Created
- Most DSB ISINs have not been reported to FIRDS (20% regulatory reporting rate)
- 10 firms continue to create 75% of all DSB ISINs – 3 venues + 7 banks
- Marked decrease in the pace of new ISIN creation – 18% month on month (MoM) increase in April vs. 24% in March and 34% in February
- Equity and FX continue to dominate
- Largest increase in new OTC ISINs for the following instruments
- Commodities Swaptions
- Loan Swaps (credit)
- Price_Return_Basic_Performance_Single_Index Swap (equity)
- Price Return_Dividend_Basket Swap (equity)
- Inflation Basis Zero Coupon Swap (rates)
- Asset Class Highlights
- Instrument Type
- Connection Type: surprising variation in user connectivity preferences across asset classes (i.e FIX or ReST)
Searches for DSB ISINs
- Top 10 firms searched the DSB database more frequently
- 15% increase in the number of search requests received in April vs. March 2018
- Users used one format of the DSB search function more heavily:
- 65% to retrieve OTC ISIN records for a given set of attributes
- 27% to retrieve an OTC ISIN record for a specific ISIN
- Significant skew in utilization of the DSB:
- 5,000 searches per week by the top 20 firms (on average)
- 9 searches per week by the remaining 318 firms that have searched the DSB database
Published by Malavika Solanki