Published by Malavika Solanki
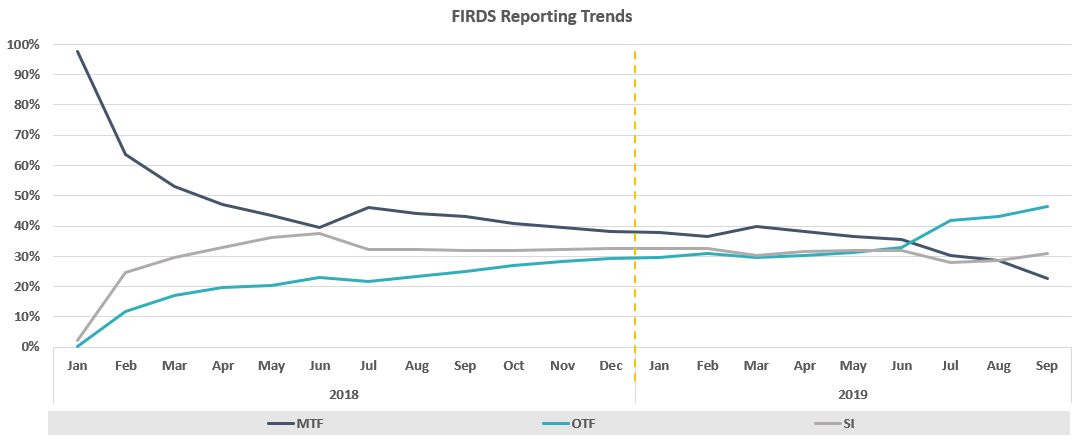
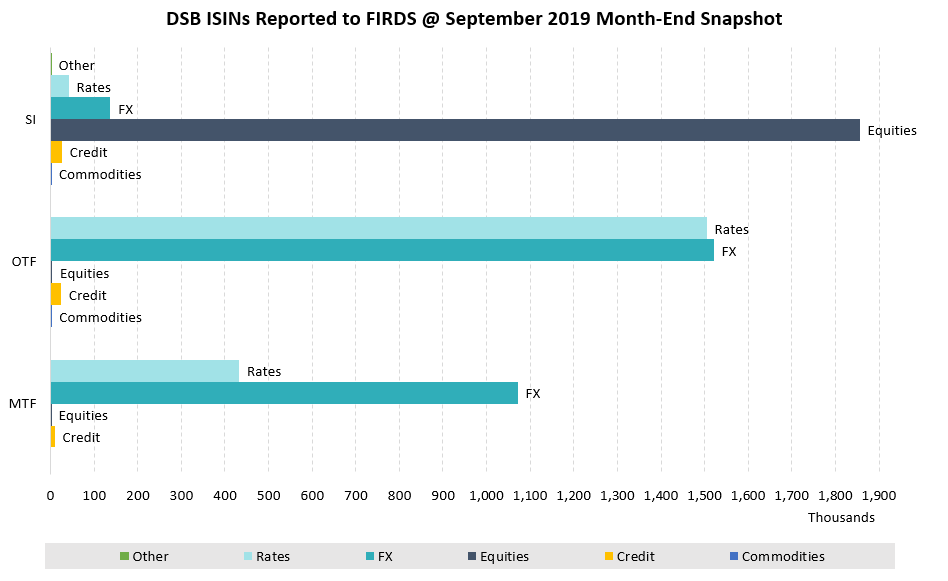
A review of live trades in FIRDS as at month-end September 2019 shows a growing divergence between the number of live trades reported by MTFs, OTFs and SIs, for the first time since the start of the year. As the chart below shows, the three had been on a largely convergent path for the past year, with the change driven by both an increase in the number of Rates instruments reported by OTFs and a reduction in the number of open FX instruments reported by MTFs.
At an asset class level (see below), we see that the volume of active FX trades in FIRDS has dropped by approximately a third (≈ 500k) and that there were approximately 700k more Rates ISINs, with the latter likely to have been driven by a revision to the way in which Term of Contract (RTS-23.Field 41) is to be determined.
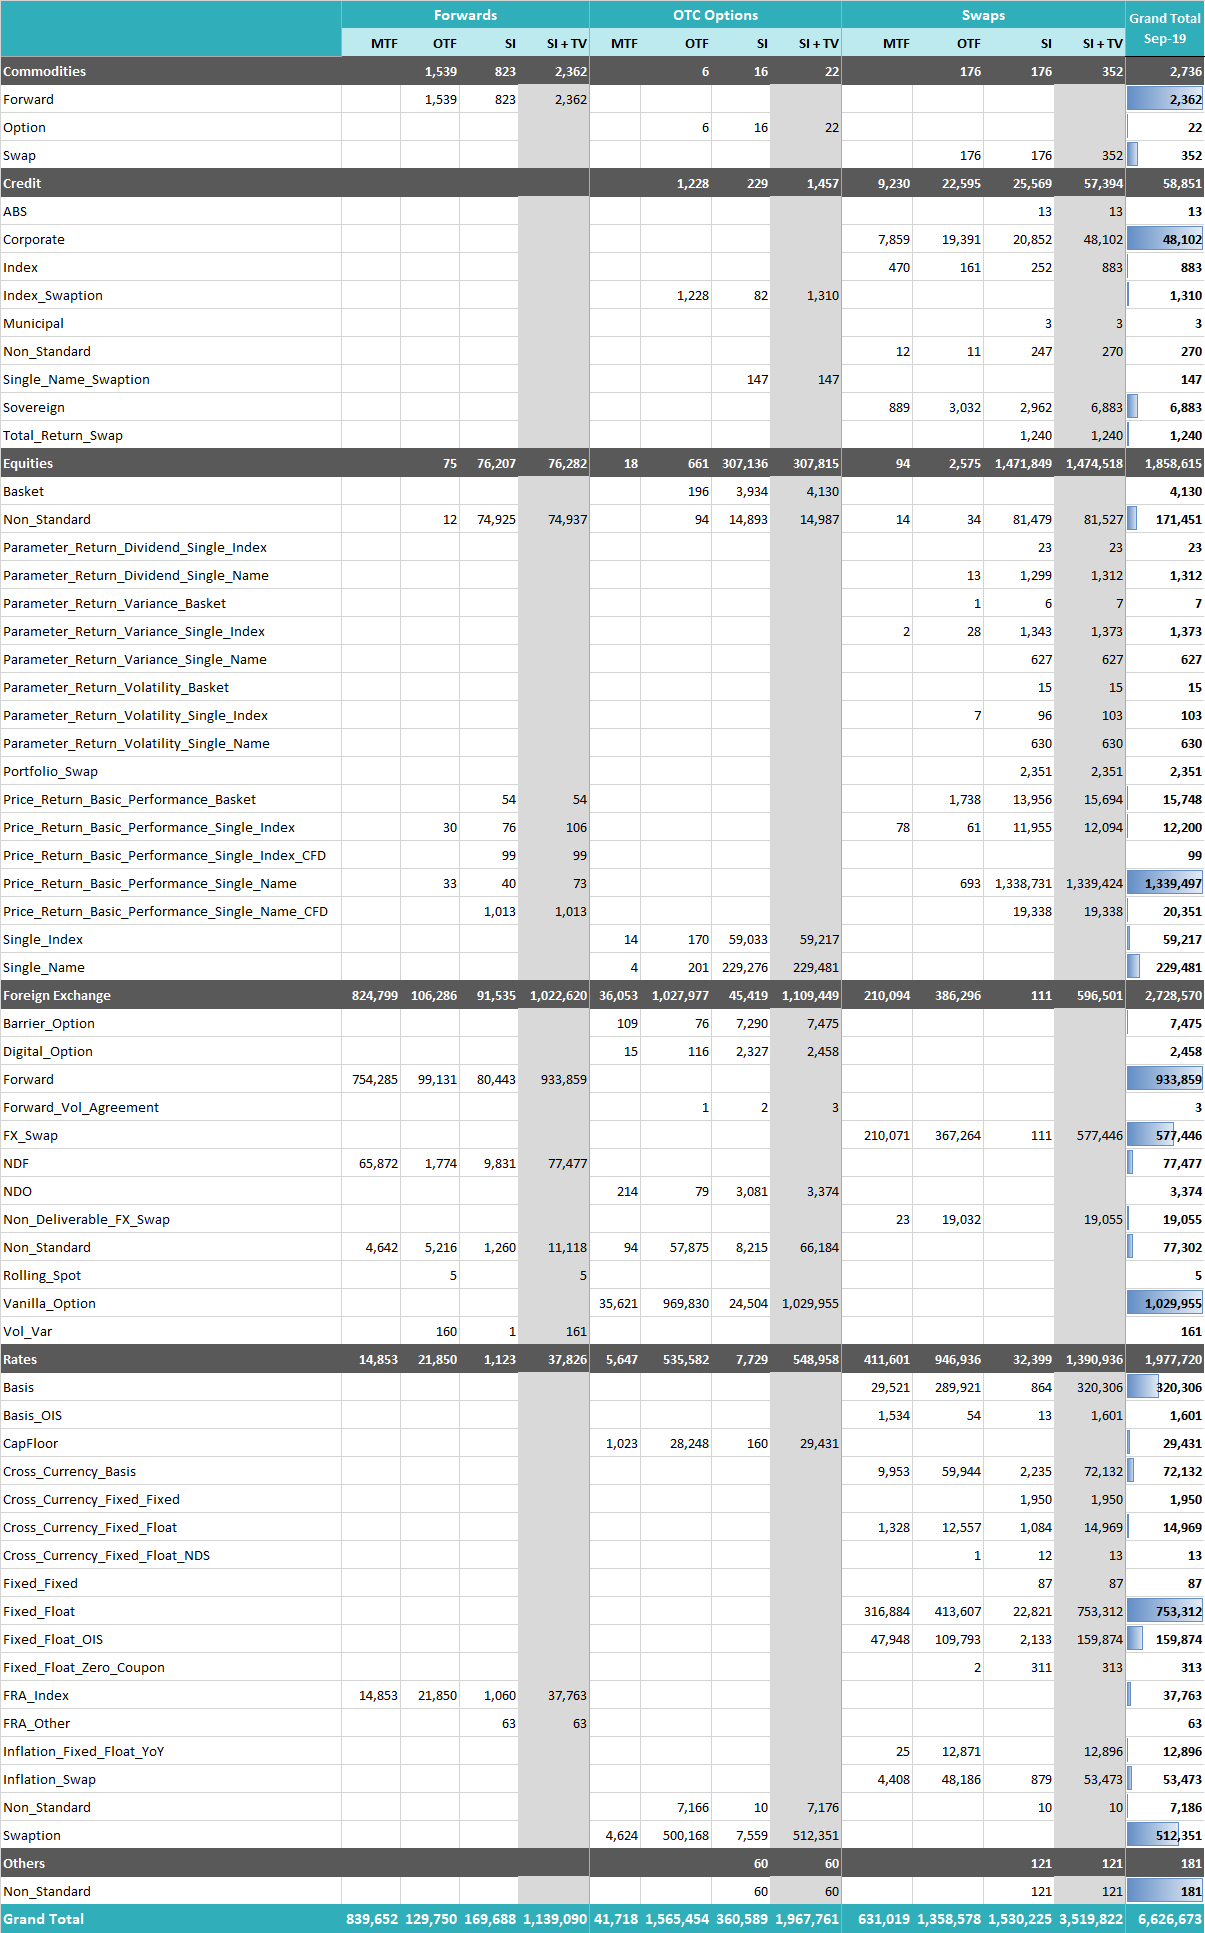
The usual product level composition is set out in the table that follows.
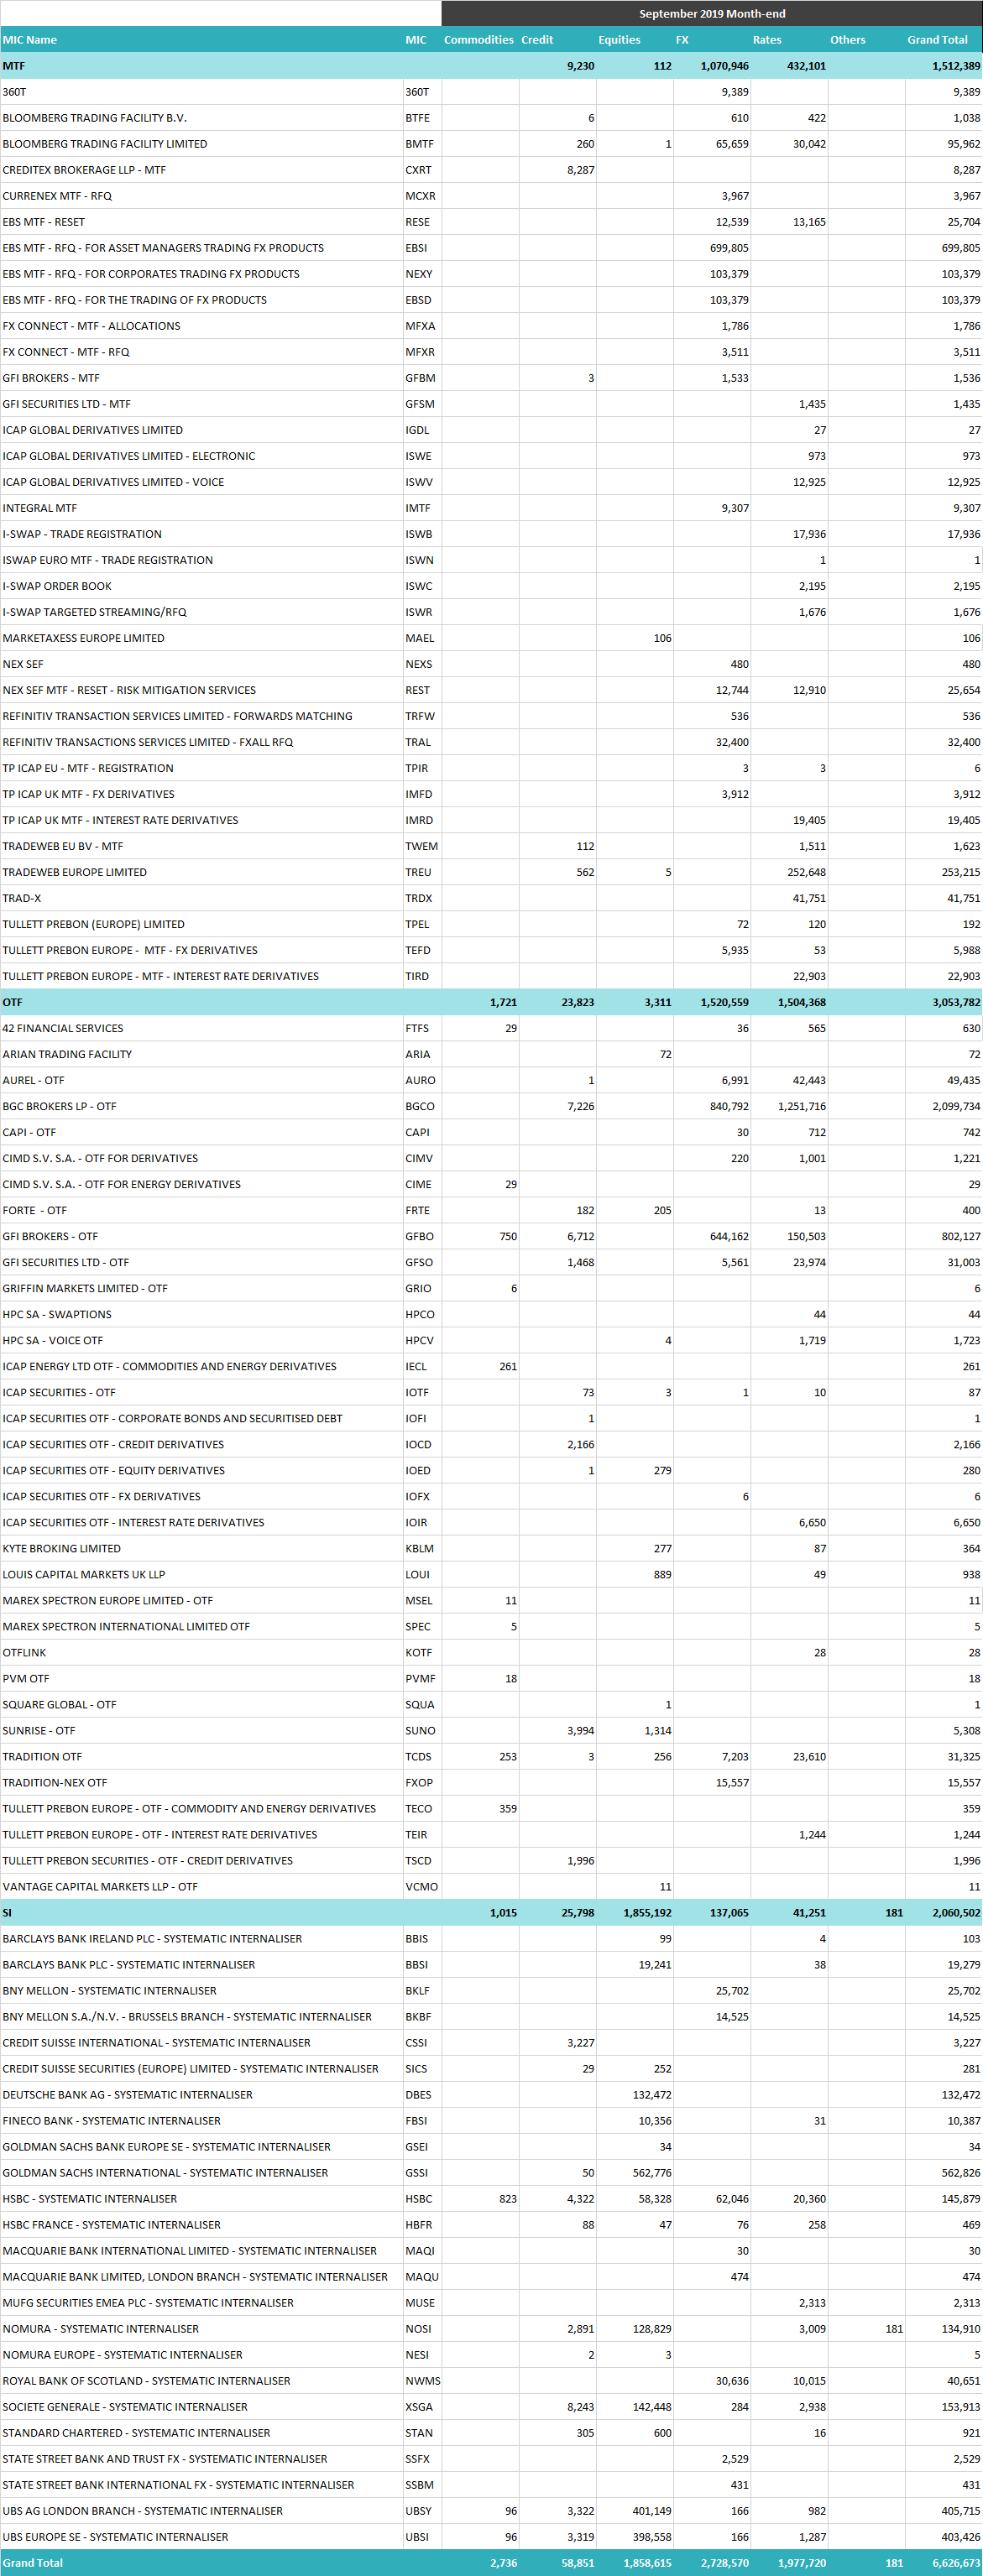
Looking at the list of specific institutions with active instruments in FIRDS as at September 2019 month-end, we see a fair amount of variation when compared with the prior quarter.
A few readers have asked us to examine the number of OTC ISINs that had ever been reported to ESMA FIRDS and FITRS. We will aim to include this data in the next quarterly blog, which has the added benefit of reviewing the metrics after 2 years of MiFID II reporting for OTC derivatives having come into force.
– END –