Published by Malavika Solanki
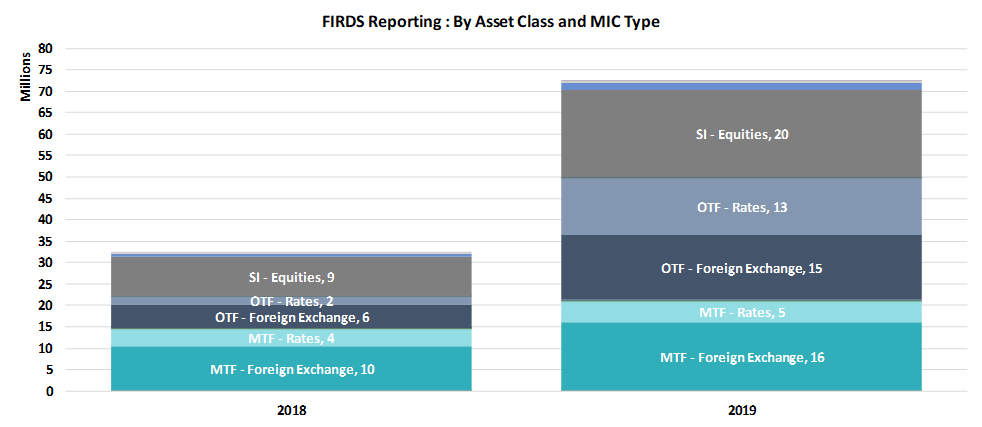
A review of live trades in FIRDS as at year-end December 2019 shows a continued divergence between the number of live trades reported by MTFs, OTFs and SIs, a theme we first reported on in our previous note on the subject. As the charts below show, the three MIC types had been on a largely convergent path for approximately a year, with the change partly driven by the increase in OTF swap instruments and a heavy decline in MTF forwards.
This first chart shows reporting trends by MIC type across 2018 and 2019. 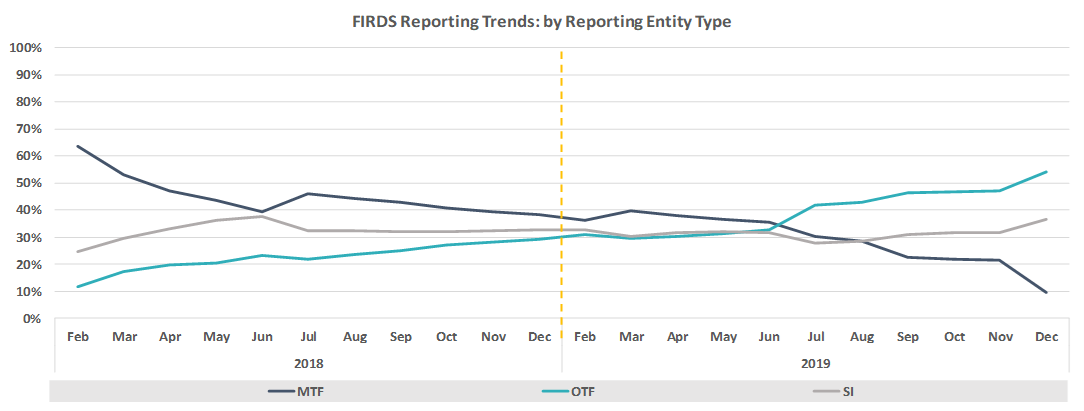
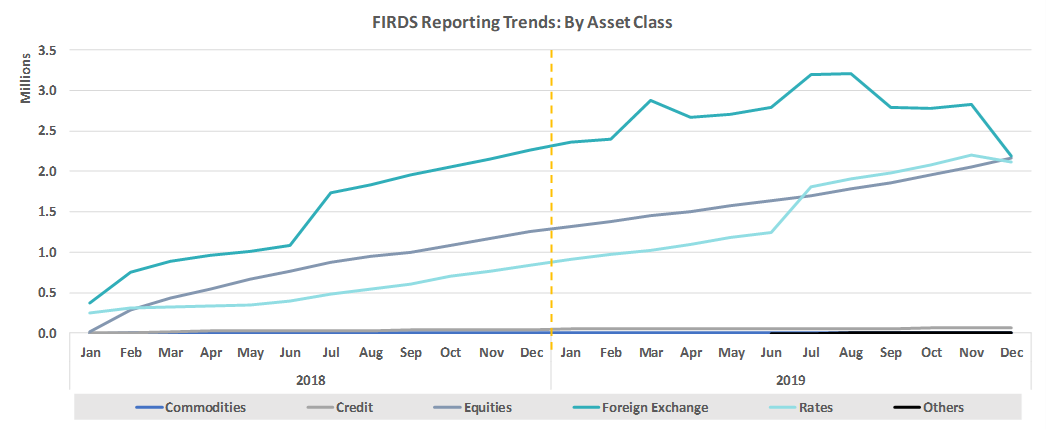
This second chart shows the same timeline, but offers an asset class based view instead. We see that Equity derivative reference data reporting continued at a steady pace, Rates derivatives reference data reporting saw an increase in the second half of 2019 and FX reference data records reduced sharply in Q4 2019.
Q4 2019 saw 5 new MTFs MICs join the group of reporting firms, while 4 MTF MICs were no longer present in the list of MICs contained within FIRDS.
When looking at the cumulative stock of reference data records within FIRDS for Q4 2019 (please see the table below), there were large swings between categories (MTFs down 945k OTC ISIN reference data records vs. OTF and SIs up 1 million). A year on year comparison of FIRDS reference data records held at year end shows reporting at year-end 2019 having increased substantially in the Rates and FX categories for OTFs and MTFs and Equitie derivatives for SIs.
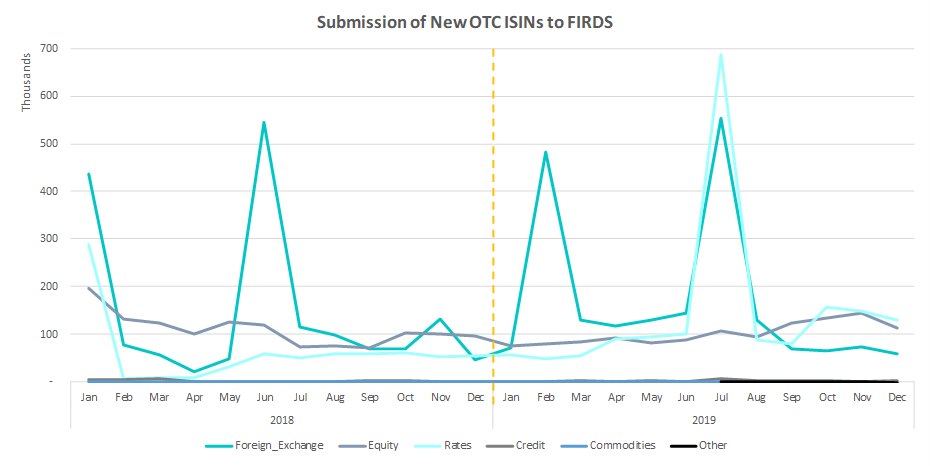
As part of the review, we also looked at when new OTC reference data records were first reported to FIRDS, and found a distinctive pattern for some asset classes. Specifically, we noted a spike in new OTC ISIN submissions to FIRDs twice a year, with FX Forwards and Swaps largely driving the trend (please see the table below).
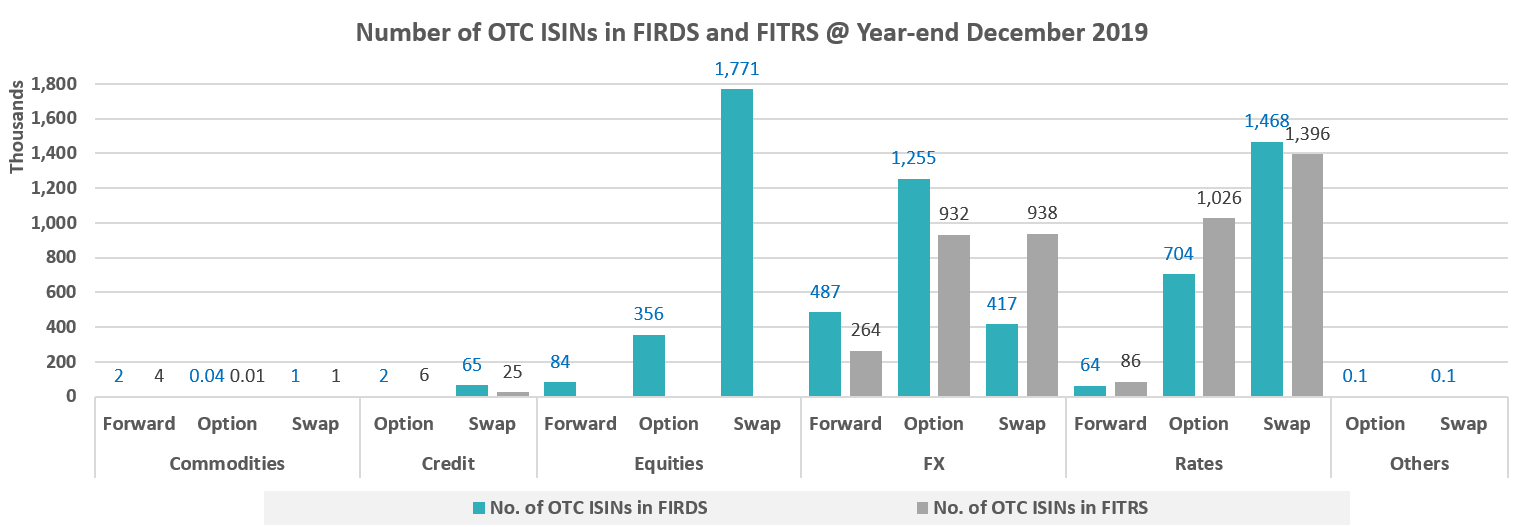
Some readers had asked us to examine the number of OTC ISINs that had been reported to ESMA FIRDS and FITRS. The chart below shows the patterns by asset class. We last published something similar for March 2019 quarter end data, so the data below has the added benefit of reviewing the metrics after 2 years of MiFID II reporting for OTC derivatives having come into force.
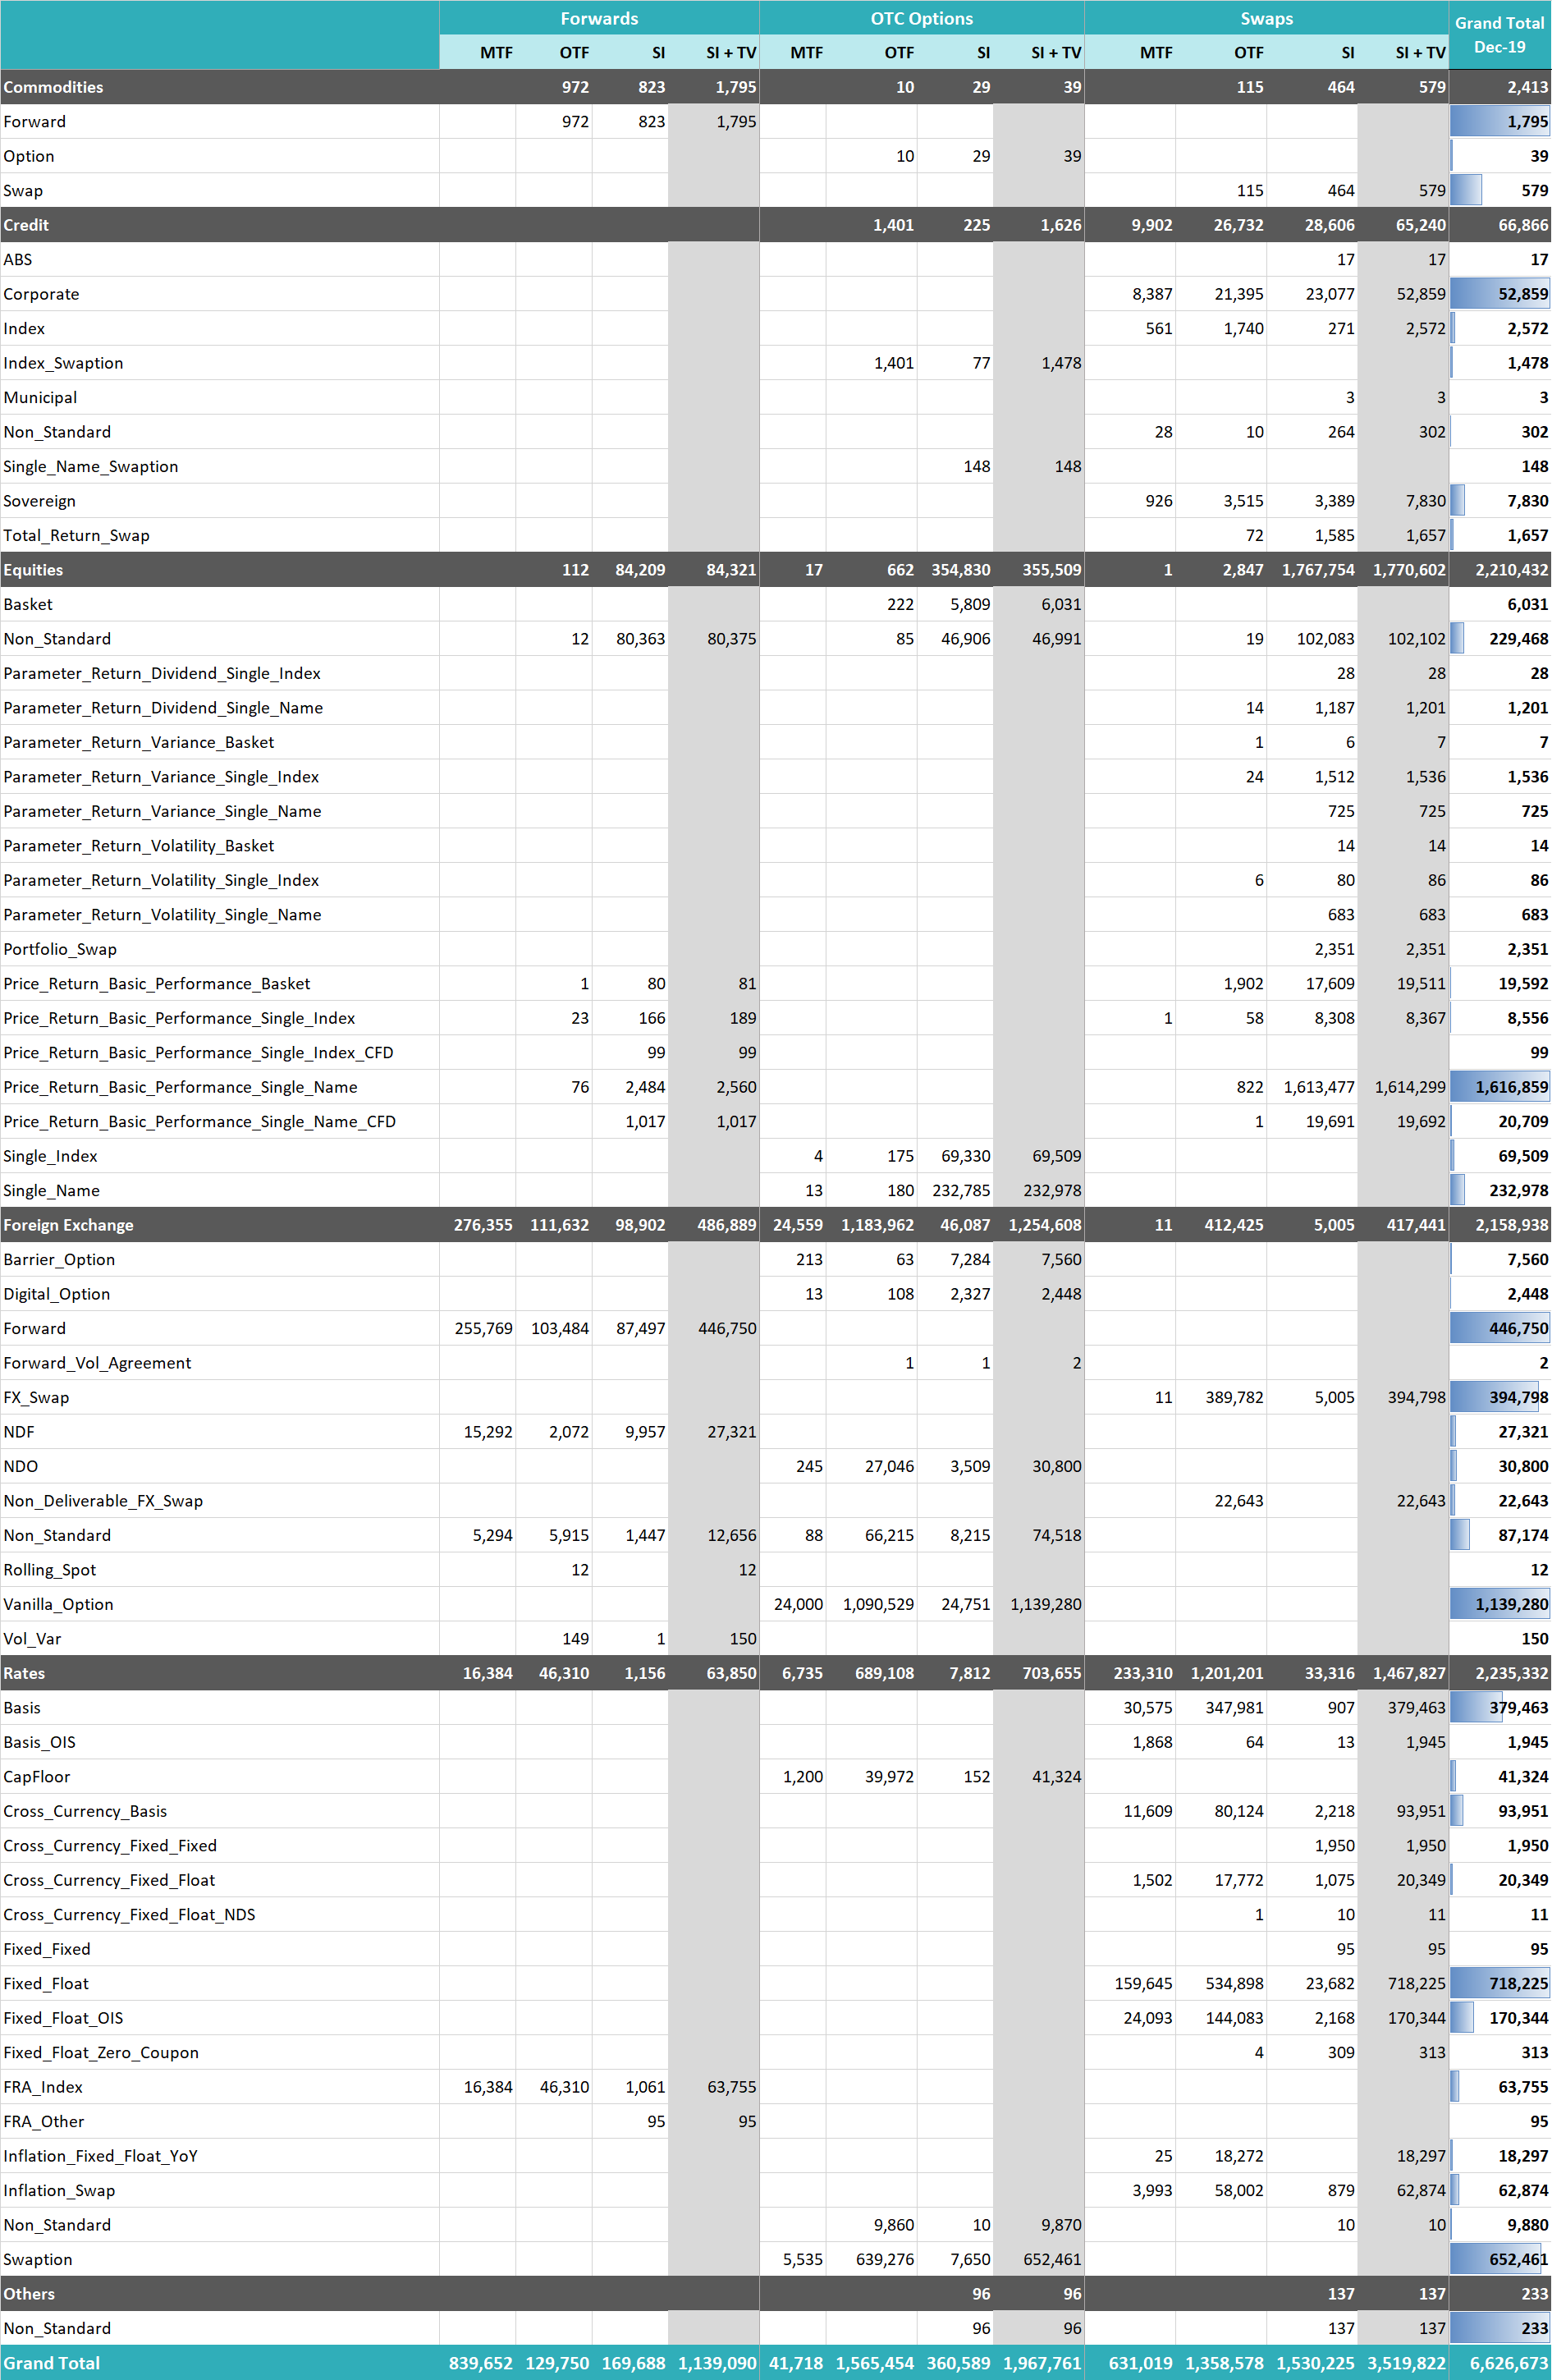
Moving on the usual metrics the DSB reports, the product level composition of FIRDS reference data records at year end 2019 is set out in the table below.
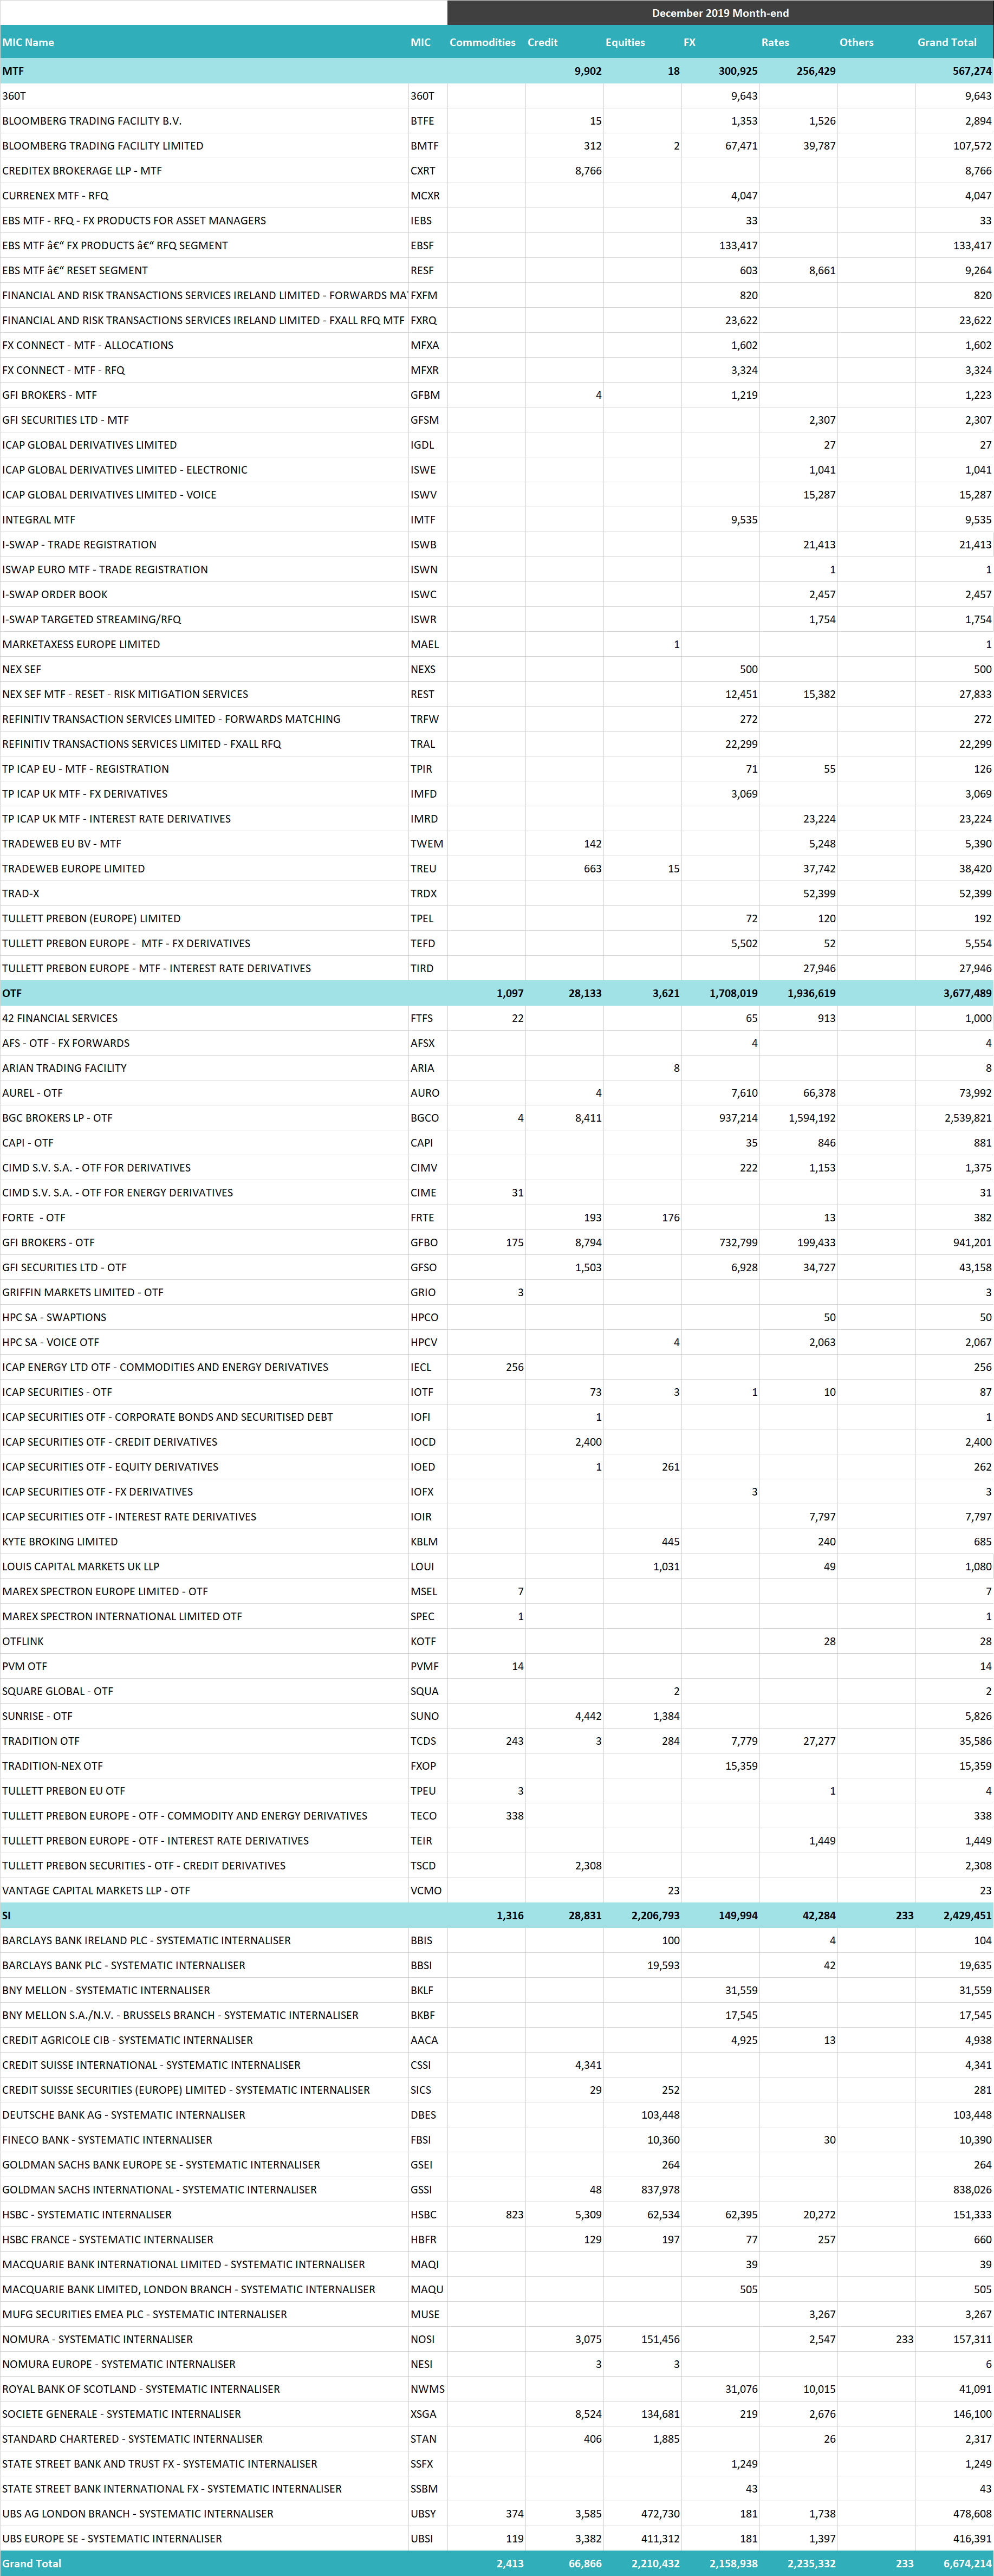
Looking at the list of specific institutions with active instruments in FIRDS as at December 2019 month-end, we see a fair amount of variation when compared with the prior quarter.
Questions and comments can be sent to otc.data@anna-dsb.com
— END —